Theory
Summative assessment
Uses and limitations of summative assessment – Professor Stuart Kime at Evidence Based Education
Video transcript
If you can picture an end of year test in your mind, you probably know what a so-called ‘summative assessment’ looks like. It’s a way of creating a snapshot in time of how you performed in a certain set of conditions on a relatively small part of the curriculum. And as such, the interpretation of scores from such assessments should reflect these facts. Crucially, don’t overinflate the importance of summative assessment data. The information produced by assessments that have summative purposes generally comes in the form of grades and scores generated by end of unit or end of year tests. Such information can help summarise students’ performance against set criteria like marking rubrics or against something like a class average score and this information can be useful for these purposes, but you should always keep in mind the limitations of it. A single grade or score can hide a lot of useful information about a student’s strengths and areas for improvement.
Keep in mind that a student’s performance on a single test, on a single day, can be affected by all kinds of things that are unrelated to what they’re being tested on. While you might want to know how well a student can do on an algebra test, the streaming cold they’re still getting over will likely affect their performance adversely. Similarly, there might be things going on at home, which are playing on their mind during the test.
And finally, students scores on summative assessments are often put onto a school system and maybe reported to parents. And this process increases both the workload involved but also the perceived importance of the information generated. Measuring and recording seem to heighten its status even though the status may be unwarranted by the accuracy and the utility of the information itself.
Summative assessment in your school is one part of the jigsaw puzzle of information you’ll assemble about students. It’s a long-term process that can reveal interesting and useful patterns about students’ learning. By triangulating the information from multiple comparable tests of the same curriculum areas, you’ll increase your confidence in making sensible interpretations of the data. Are there certain tasks that students continually struggle with? Do you or colleagues need to intervene to address specific, deeply embedded misconceptions?
Assessments with summative purposes should be used sparingly in school. If you want to see if your students have made progress from time point A to time point B, they need time to improve sufficiently for the tests to detect a meaningful difference. In and amongst all the noise that I mentioned before, many schools are now decreasing the number of summative assessment points that they have during a school year and are also trying to be more transparent with their students about why they’re doing them. Some are also studying the reliability of the data they generate and being clearer about what you can, and crucially cannot, say about a student’s performance.
A snapshot in time
As highlighted in the video above, summative assessments offer a “snapshot in time” of pupil performance. They test a cross section of pupil knowledge of the curriculum and allow performance to be recorded as a grade descriptor (e.g. ‘Emerging’ or 8). These grades are useful for establishing a shared understanding about pupil performance in comparison to others.
Earlier in the module the difference between ‘learning’ and ‘performance’ was referenced. How a pupil performs in a test is not necessarily a direct reflection of their learning. External factors could have a negative impact on performance. Similarly, the questions in the test could play to the strengths of the pupil and their performance could be better than their pattern so far. It is therefore important to be aware of the limitations of summative assessments and be mindful about what inferences you can make from the data. You may hear a pupil who performs poorly in a summative test exclaim “I am no good at this subject!”, but when you review their performance patterns over time, it might be that their understanding is not secure in a few subject areas, but their overall subject knowledge is good. Paying attention to a pupil’s general patterns of performance over time will give you a better judgement overall.
Avoiding misleading factors
There are two types of summative tests:
- the ‘difficulty model’ where the questions get harder as the test goes on
- the ‘quality model’ which are generally essays or performance pieces
For summative tests to produce any shared meaning, they must consist of standard tasks. Both models must be completed in controlled conditions, in order for them to be a reliable indicator of performance. Using externally validated materials which have been nationally standardised also allows you to create a shared meaning of how your pupils are performing compared to the national picture.
However, the validity of the judgements that can be made are more difficult with assessments that follow the quality model. This is simply down to the fact that quality model assessments usually have a mark scheme based on descriptors (rubrics). Markers may interpret the descriptors differently within an essay style question, and the same question may receive a different grading from separate markers.
A way to negate this interpretation issue, and avoid any misleading factors that could impact on accurate assessments, is to moderate teacher judgments in teams. Moderation requires all teachers to review the same essay question or performance piece and discuss what judgment they would give and why. This is a task that needs to be repeated often in order to improve judgments overall. Over time, it will improve the reliability of the marks awarded by individual teachers and ensure better consistency across teams.
Analysing data
When analysing your summative data, you will be looking for patterns in performance in classes, across topics, and with individual pupils.
There may be topics where there is a pattern of pupils generally scoring consistently low in certain areas – you would therefore know that those pupils would benefit from the content being retaught. You will also be looking for pupils that require further targeting as a method of improving their performance.
As referenced in the video above, summative assessment data can have a higher ‘perceived importance’ due to the reporting of it. However, it is important to remember that the grade boundaries are ‘lines in the sand’ and it is vital that you look beyond them and not simply target those that are in the lower boundaries.
It is also useful to only record data when it is useful for improving pupil outcomes and not be attempting to capture summative ‘snapshots’ of data when formative assessments would be a more beneficial method of data collection.
A good example of this is given by Daisy Christodoulou in her book ‘Making Good Progress’.
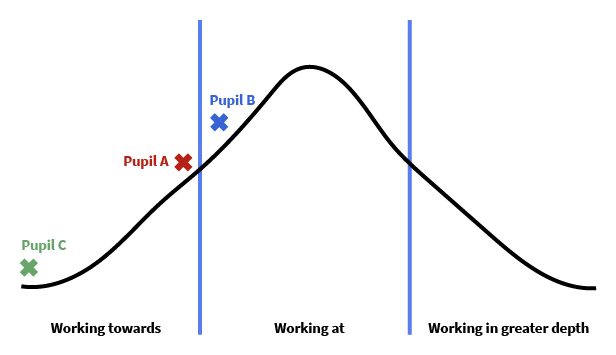
The graph highlights that pupil A and pupil C are given the same grade; both have been classed as ‘Working Towards’. However, you can see that the scores of pupil A and pupil B are closer and they have more in common.
If you were to pay attention to the grade boundaries only, you may target pupil C and A more than pupil B. However, it is clear that pupil B has only just crossed the grade boundary and therefore could - in another summative assessment – be graded as ‘Working Towards’.
This highlights that grading systems can be misleading, and it is important that teachers consider the narrative around their data when making inferences and decisions based on their data analysis.
Analysing data activities
Complete one of the activities below.
Activity 1
Select a recent summative assessment completed by an individual pupil. This could take the form of a test, a piece of writing, a performance or any form of assessment that ‘sums-up’ learning over time.
Analyse their assessment carefully and consider the following questions:
- is this assessment based on the ‘difficulty model’ or the ‘quality model’?
- does pupil performance in this test reflect their general pattern of performance over time?
- as you analyse the test, has the pupil made mistakes, or do they have errors in their knowledge?
Reminder
Mistake: something a pupil can do, and does normally do correctly, but has not on this occasion.
Error: which occurs when answering something that a pupil has not mastered or has misunderstood.
Prepare to discuss your answers around the performance of this pupil with your mentor.
Record your findings in your notebook.
Activity 2
Select a recent dataset and identify pupils that are very close to the boundaries of their grades. This must include pupils at both the lower and higher grade boundaries. Consider the following questions:
- who are the pupils that are at risk of potentially moving into the lower grade boundary?
- who are the pupils that, if targeted, could move into the higher grade boundary? Select one pupil from the list you created using the questions above. What strategies could you use to target this pupil and increase their progress?
Prepare to discuss your answers around the performance of this pupil with your mentor at your next interaction.
Record your findings in your notebook.